Gauging success in myopia management

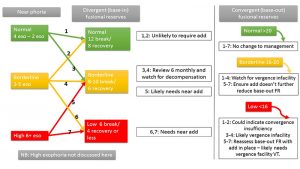
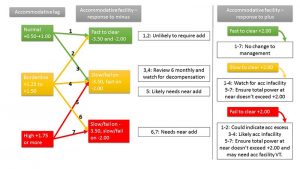
How can you tell if your myopia management strategy has been a success? Our new Myopia Profile ‘Managing Myopia Guidelines’ infographics translate research into practice, providing advice on gauging success by both refraction and axial length outcomes. Given that refraction is universally measured in clinical myopia practice, there is particular emphasis on understanding how much refraction change after a year of treatment indicates whether expected efficacy for that intervention has been attained.

Measuring near lag of accommodation

Assessing accommodative function, such as measuring near lag of accommodation, is a vital component of understanding the myopia profile of your patient. In this post Dr Kate Gifford describes how to measure accommodation lag in practice.

Axial length measurement in myopia management – how often and how much change is normal?

How frequently should we measure axial length in myopia management practice, and how should it best direct our treatment strategy? Here we discuss how axial length change is related to refraction and ethnicity, and how to determine whether an axial length change is normal due to emmetropization or indicating myopia progression.

Prescribing adds for near esophoria

From a myopia control point of view, esophoria and accommodative lag are the key clinical red flags in assessing your patient’s visual efficiency, and thankfully both will usually respond positively to a near addition.

Assessing near phoria

Kate describes near heterophoria to her patients as where their eyes aim in space – the posture of their vergence system – and esophoria is our key enemy in the myopia control battle.

Assessing fusional reserves at near

Assessing horizontal fusional reserves at near gives you the measure of your patient’s stamina, or ‘petrol in the tank’ to be able to manage their phoria, or ‘posture’.

Prescribing adds for accommodation lag

Given that a normal lag result is +0.50, I would generally prescribe an add which is the accommodative lag result subtracting 0.50, so the resulting final lag is within the normal range. For example, a lag of +2.00 results in a +1.50 Add; a lag of +1.50 results in a +1.00 Add. However, this formula may not work if:

Measuring accommodative facility

Assessing accommodative function at near is a vital component of understanding the myopia profile of your patient. Myopic progression in children and adults can be influenced by binocular vision function.